Researchers at Northeastern University have developed several new methods and measures for estimating various standard information retrieval (IR) measures quite well using surprisingly small samples of the usual TREC-style pooled judgments. One of these measures, inferred average precision (infAP), is being used in evaluating the feature task submissions in TRECVID 2006 after testing on TRECVID 2005 data demonstrated its utility. This page reports on that testing and the results.
The notion of inferred average precision arises from thinking about average precision as the expected value in a random experiment. In this thought experiment a relevant document is chosen at random from a list and one asks what the probability of getting a relevant document at or above that rank is, i.e., what the expected precision at that rank is. The probability of getting relevant document at or above the rank corresponds to precision at the rank. Picking a relevant document at random corresponds to averaging these precisions over all relevant documents. More background and the derivation of the actual measure can be found in the following paper:
Estimating Average Precision with Incomplete and Imperfect Judgments
Emine Yilmaz and Javed A. Aslam. To appear in Proceedings of the
Fifteenth ACM International Conference on Information and Knowledge
Management (CIKM).  November, 2006.
Here is a brief introduction to the inferred average precision, compliments of Yilmaz and Aslam.
For TRECVID 2005, the submitted system results were pooled down to at least a depth of 200 items in the ranked results for each system run and the shots in those pools were manually judged - forming a base set of judgments for the experiments.
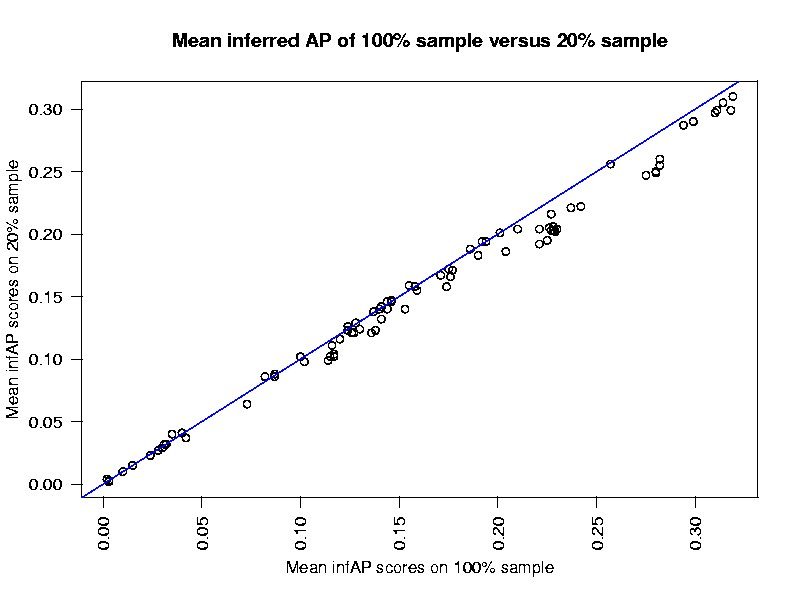
Four other sets of judgments were created by randomly marking 20%, 40%, 60% and 80% of the base judgments as "not judged", forming 80%, 60%, and 20% samples respectively of the base judgments.
All systems that submitted results for all features in 2005 were then evaluated for the base and each of the 4 sampled sets of judgments using the definition of infAP now built in to trec_eval. By that definition, infAP of a 100% sample of the base judgment set is identical to average precision (AP).
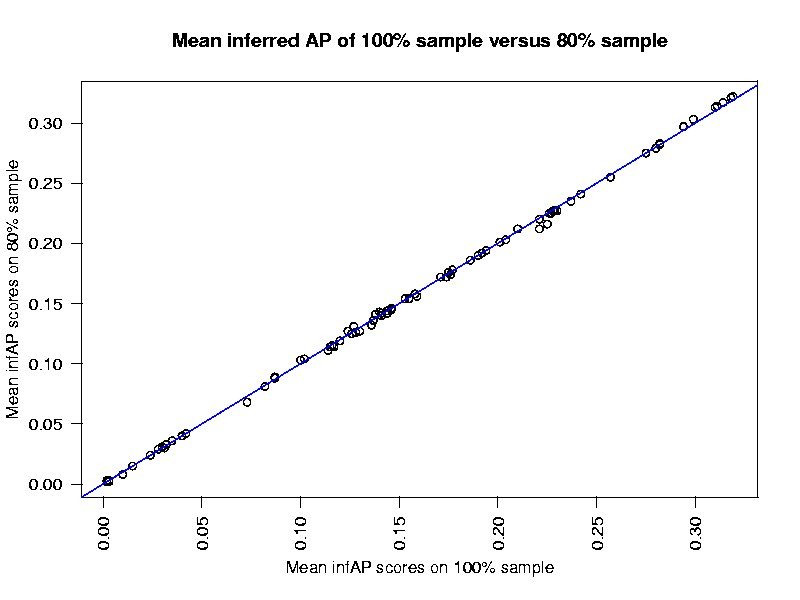
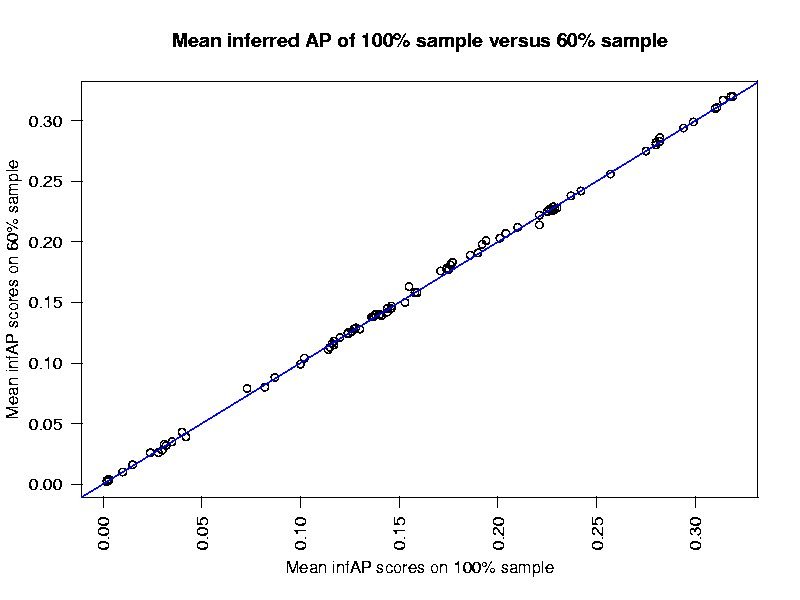
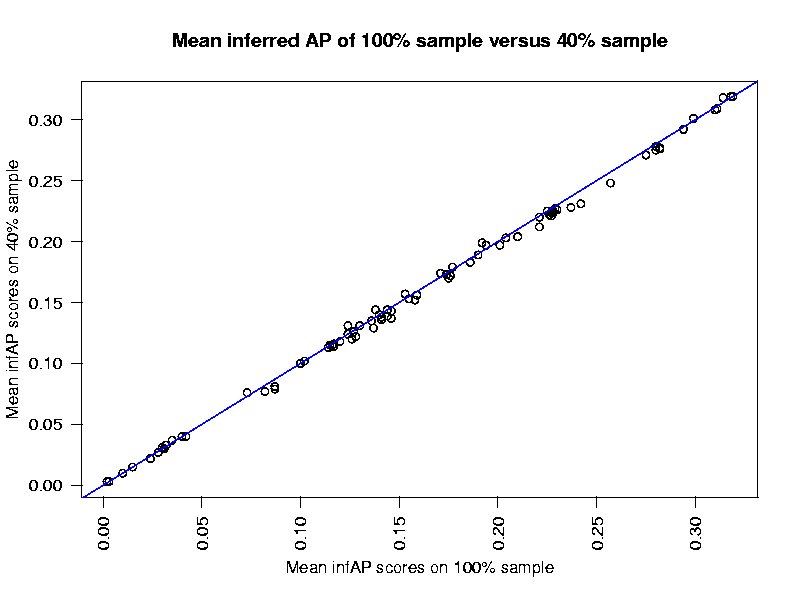
The results based on the sampled judgments were then compared to those based on the base judgments. InfAP scoring approximates AP scoring very closely. System rankings change very little when determined based on infAP versus AP.
What do the distributions of infAP run scores look using ever smaller samples of the base judgment set?
   		Min.    1st Qu. Median  Mean    3rd Qu. Max.
100% sample	0.0020  0.1145  0.1460  0.1583  0.2265  0.3190
 80% sample	0.0020  0.1125  0.1460  0.1580  0.2250  0.3220
 60% sample	0.002   0.112   0.147   0.159   0.226   0.320
 40% sample     0.0030  0.1135  0.1440  0.1563  0.2230  0.3190
 20% sample	0.0020  0.1020  0.1460  0.1500  0.2035  0.3100
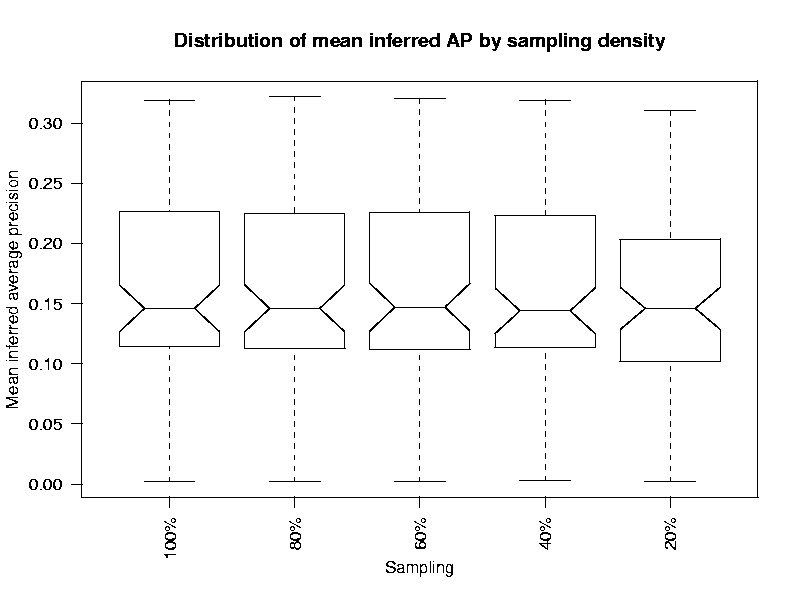
How well do the infAP scores using ever smaller samples of the judgment set match the AP scores.
80% sample 0.9862658
60% sample 0.9871663
40% sample 0.9700546
20% sample 0.951566
80% sample	0.9996353
60% sample	0.999618
40% sample	0.9991702
20% sample	0.995474
80% sample	0.002383
60% sample	0.002438
40% sample	0.003594
20% sample	0.008386
              Swap	Lose	Keep	Add

80%  sample	0	 35	2018	37
60%  sample	0        57  	1996    36
40%  sample	0    	104  	1949    45
20%  sample	0    	170  	1883    73
 Last
updated: